Lesson 1: Looking at Baseball Statistics (Rookie)
Objective:
• Identify the meaning of abbreviations related to player statistics on baseball cards.
• Recognize statistics as whole numbers or decimals.
• Order whole numbers and decimals.
Time Required:
1 class period
Materials Needed:
- Baseball cards – enough for each student to have one
- Calculators
- Pencils and paper
Vocabulary:
Batting Average - A measure of a batter's performance, calculated as the number of hits divided by the number of times at bat
Earned Run Average (ERA) - A measure of a pitcher's effectiveness; calculated as the average number of earned runs allowed by the pitcher for every nine innings pitched
Lineup – A list of players taking part in a game
Roster – A list of players on a sports team
Statistics - A branch of mathematics dealing with the collection and analysis of numerical data
Lesson
1. Begin by asking students to name some of their favorite sports.
2. Choose an example from the sports named by students. Ask, “In this sport, how do you know which players are the best (or the best at their position)?”
3. Discuss that in almost every sport, players are evaluated or judged using numbers and mathematics. Players compete for distance, speed, goals scored, etc. This is especially easy to see during sporting events like the Olympic Games where even the smallest differences in numbers could mean winning a medal or winning nothing.
4. Ask students, “How are baseball players evaluated or judged? How do we keep track of a player’s success at the plate or on the mound?”
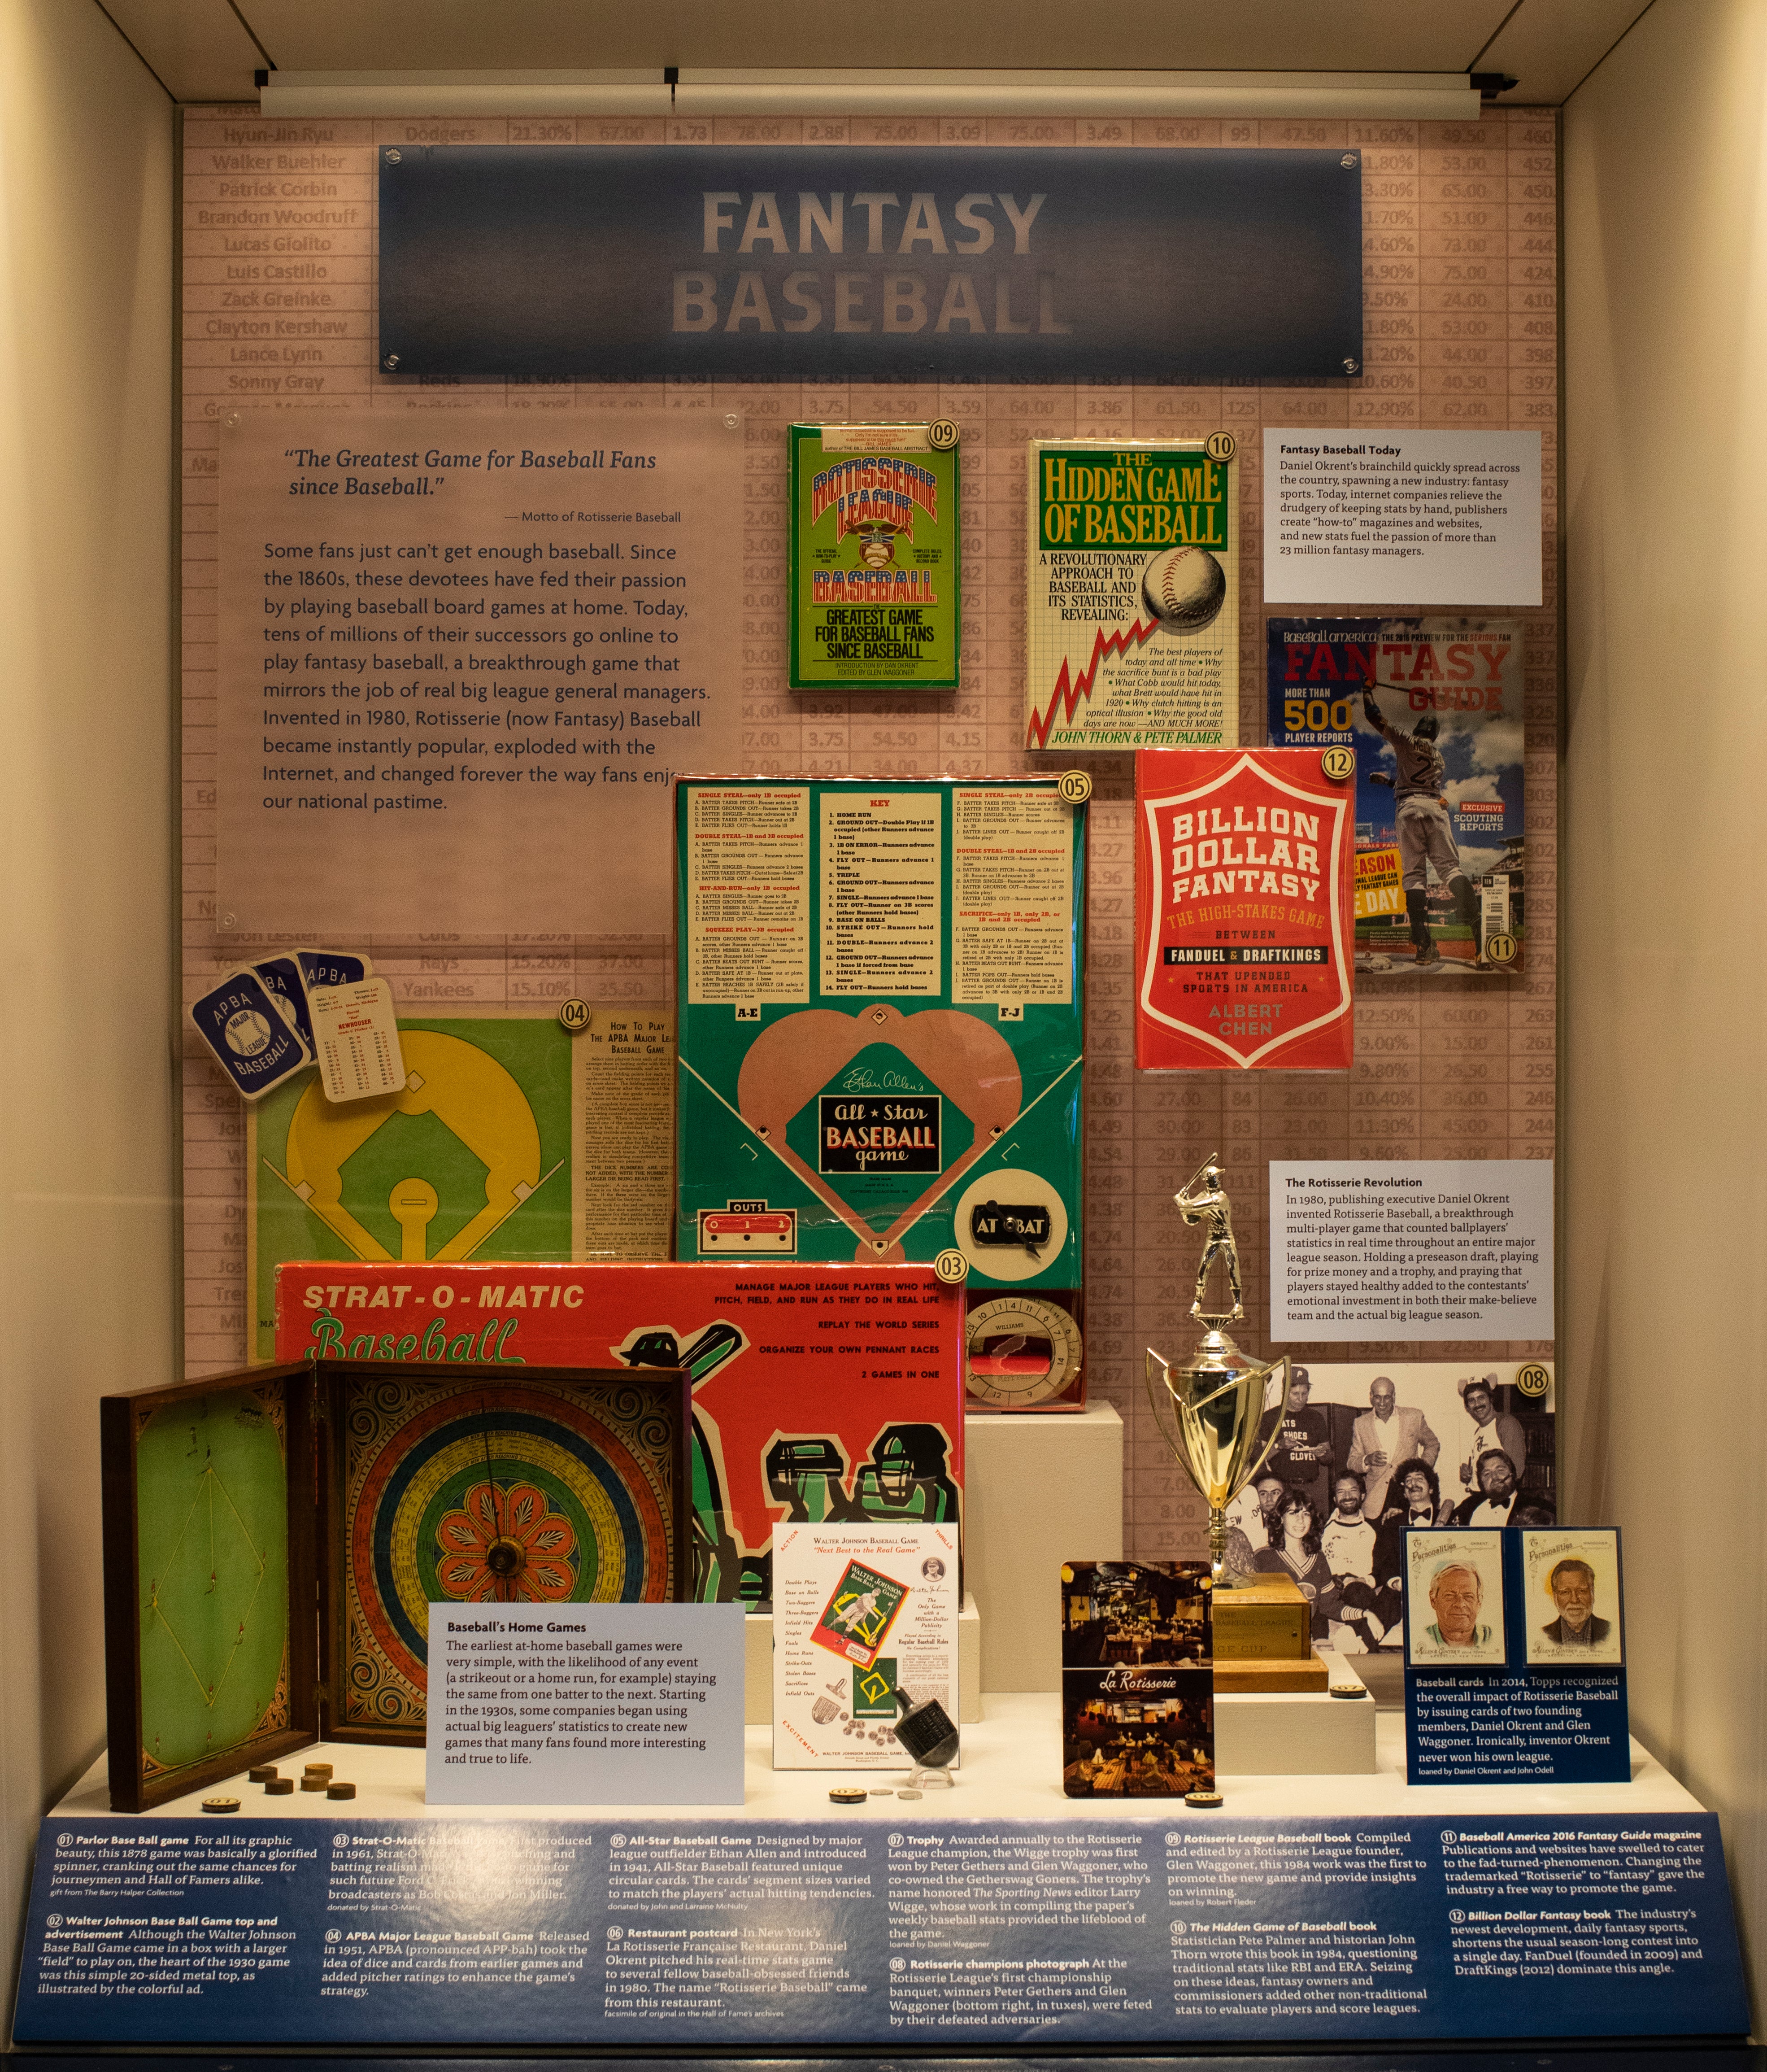
5. Give each student one baseball card and have students examine the information on the back of each. Ask, “What sort of information is available on a baseball card?”
Information examples include: player height, player weight, dominant hand, birthday, team, special accomplishments, and statistics.
6. Point out that baseball has its own language. There are special codes for the different statistics listed on the back of the card. For example, BA = batting average, G = games played, AB = at bats, R = runs, H = hits, 2B = doubles, 3B = triples, HR = home runs, RBI = runs batted in, SB = stolen bases.
7. Pitchers have special codes for their statistics as well. W = wins, L = losses, ERA = earned run average, etc.
8. Ask students to identify which statistics are represented by whole numbers, and which are represented by decimals.
9. Explain that all of these statistics, and others not listed on the cards, are used by team owners and managers when they are evaluating a player’s talent.
10. Have students look at their baseball cards again. Ask students, “Who thinks their player may have the most hits (H) out of all the players in this room?” Allow students to compare their players until the player with the most hits is determined.
11. Continue in this manner allowing students to determine which player has the most home runs, stolen bases, games played, etc. Include pitchers as well by asking, “Which pitcher had the most wins?” “Which player had the most losses?”
12. Finally, draw students’ attention to batting average (BA). Lesson 2 and Lesson 3 will explain this concept further, but you may briefly tell students that a batting average is a way to show how successful a batter is. The better the batting average, the more successful a player has been in getting hits. Have students compare their players until the player with the highest batting average is determined.
13. Introduce the activity.
Activity
1. Explain that a standard major league baseball roster has 25 players, but only 9 of those players can start the game.
2. Remind students that there are lots of ways to measure a baseball player’s talent, but explain that today they will be using batting average to determine the best batters.
3. Have students work together to create the best batting lineup for a team based on their players’ batting averages (choose the top 8 players).
4. Remind students that one player in the lineup must be a pitcher. Now have students work together to choose the best pitcher to start for their team.
Conclusion:
To complete this lesson and check for understanding, have students design and create baseball cards for themselves. The cards should list their position and include statistics, such as games, at bats, hits, doubles, triples, home runs, batting average and runs batted in. Use a digital camera and printer to incorporate photos of the students.
Common Core Standards
CCSS.Math.Content.4.NBT.A.2 Read and write multi-digit whole numbers using base-ten numerals, number names, and expanded form. Compare two multi-digit numbers based on meanings of the digits in each place, using >, =, and < symbols to record the results of comparisons.
CCSS.Math.Content.5.NBT.A.3 Read, write, and compare decimals to thousandths.