Lesson 3: (Pre-Visit) The Cost of Being a Fan (Intermediate)
Objective: Students will be able to:
• Identify factors that affect the supply of tickets, and the demand for tickets.
• Recognize that demand for a good or service exists when consumers have the ability and the desire to buy it.
• Find local entertainment opportunities, compute the cost of attendance, and compare the data with the cost of attending a professional baseball game.
Time Required: 1 class period
Materials Needed:
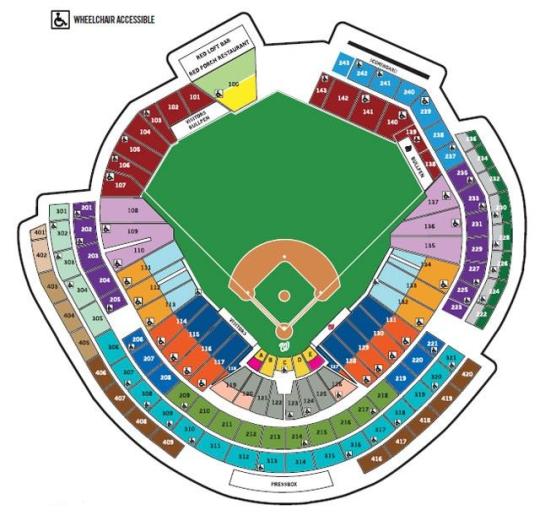
- A printout of Nationals Stadium Seating Chart (included)
- Several copies of the Arts and Entertainment section of your local newspaper
- Printed copies of The Fan Cost Index for 2011 for each student (found at https://www.teammarketing.com/public/files/2011_mlb_fci.pdf)
Vocabulary:
Consumer – A person who buys or uses a good or a service
Cost - An amount that must be paid or spent to buy or obtain something
Demand - The quantity of a good or service that buyers are willing and able to buy at all possible prices
Equilibrium - The price at which the quantity demanded by buyers equals the quantity supplied by sellers
Market - Places, institutions or technological arrangements where or by means of which goods or services are exchanged
Profit – Money earned by a business after all operating expenses have been met
Supply - The amount of a good or service that producers are willing and able to offer for sale at each possible price during a given period of time
Lesson
1. To begin this lesson, discuss that a Major League Baseball team owners, like other business owners, are interested in making the greatest possible profit with the lowest possible cost. Since ticket sales contribute to a team’s income, team owners set ticket prices at the high end of what their fans are willing to pay. The amount that fans are willing to pay is directly related to one of the key concepts of economics: Supply and Demand.
2. Review ticket supply. Three primary factors affect the supply of sports tickets:
• The Number of Seats in Ballpark -The physical number of seats in a baseball park does not change from year to year, unless a team has decided to build a larger stadium or to add seats. What does change from year to year is the type of seats. Provide students with the seating guide for Nationals Park in Washington, DC – the home stadium of the Washington Nationals. Have students determine what the various colors on the seating chart represent. Each different color indicates a different seating section. Tickets for each section are priced differently. The least expensive seats will be the ones at the far edges of the stadium. The most expensive ones will be right behind home plate or in luxury suites. Each year, the team will decide how it wants to divide up the seats in the stadium, and what it will charge for each different section of seats.
• The Number of Games in a Season - Each MLB team plays 162 games in a season. During a regular season, teams will host between 79 and 81 games at home and play the rest of its games on the road. Although some cities sell more tickets than others, the league has to allow every team the chance to host a similar number of home games.
• The Number of Teams Supplying Games - Leagues tightly control the number—the supply—of teams. If the supply of teams increases, then existing teams might lose some of their fans, and lose money. The last two teams to join Major League Baseball were the Tampa Bay Rays and Arizona Diamondbacks – both joined in 1998.
3. Review ticket demand. Discuss that demand for sports tickets exists when fans have the ability and the desire to buy them. A number of factors can influence demand:
• Changes in consumer income - When people get paid more to work, they often have extra money to spend on leisure activities. This creates a greater demand for professional sports and other forms of entertainment. When people lose jobs, or have a reduction in pay, they have less money to spend on leisure activities and the demand for sports and entertainment decreases.
• The number of consumers in a given market - New York and Los Angeles are big markets with more prospective ticket buyers and television viewers. Cincinnati and Pittsburgh are considered small markets. The average small market team might draw only a half to two-thirds as many fans as a team in a large market.
• Changes in consumer attitudes, tastes, and preferences - After the 1994-95 baseball strike, many fans lost interest in professional baseball. Overall attendance dropped during the 1995 season, and many teams offered special ticket promotions as incentives for fans to come back.
• Changes in the price of an associated product - Many other costs—parking, food, and souvenirs—go along with buying a sports ticket. When the price of associated products goes up, fans might think twice about going to a game.
4. Discuss that the market for sports tickets, or any other product, comes into balance—into equilibrium—when the quantity of tickets that fans demand equals the quantity of tickets that teams supply. Markets are said to be in equilibrium when:
• Sellers are satisfied with the quantity they are selling at a certain price.
• Buyers are buying all they want at that price and would not want to buy more at a higher price.
5. Discuss that in everyday economic life, markets rarely reach equilibrium because supply and demand continually change. For example, in the early 2000s, demand for sports tickets was strong in most major markets, while the supply of tickets remained constant. Many teams chose to raise ticket prices, and most fans continued to buy tickets – even at the new higher price. By 2007, attendance numbers peaked. During the following seasons, however, changes in the U.S. economy resulted in many families seeking ways to save money. For many fans, sports tickets, along with concessions and parking were simply not affordable.
Activity
There’s no doubt about it, going to a professional sporting event is expensive! How does a ballgame compare to other forms of family entertainment?
1. Divide the students into several groups.
2. Give each group a copy of the Fan Cost Index for 2011. Explain that The Fan Cost Index measures what it would cost a family of four to attend a major league game at any given stadium. The cost of attendance includes: four average price tickets, parking for one car, four small sodas, four hot dogs, two small beers, two game programs, and two souvenir caps.
3. Have each group choose a recorder. Allow each group a few minutes to look over the Fan Cost Index and record observations on the various prices. Where would it cost the most to attend a game? Where would it cost the least?
4. How does the cost of attending a professional baseball game compare to the cost of other family entertainment options? Give each group a copy of the Arts & Entertainment section of your local Sunday newspaper or have them go online and compare the cost of five different entertainment options.
5. Each group should calculate the cost of their 5 chosen entertainment activities for a family of four!
6. Once all groups are finished, ask each group to volunteer one or two of the activities they researched and what those activities cost. Keep a running list on the board for comparison.
7. Once all groups have reported, ask the class how the cost of a baseball game compares with the cost of the entertainment options they found? Which entertainment options are most affordable for a family of four?
Conclusion:
To conclude this lesson, review with your students the relationship between supply and demand and ticket prices. What factors influence supply? What factors influence demand? To check for understanding, have students write a response essay explaining under what circumstances a team would choose to lower ticket prices, and under what circumstances a team would choose to raise prices.
Common Core Standards
CCSS.ELA-Literacy.RI.6.7 Integrate information presented in different media or formats (e.g., visually, quantitatively) as well as in words to develop a coherent understanding of a topic or issue.
CCSS.ELA-Literacy.W.6.4, W.7.4, W.8.4 Produce clear and coherent writing in which the development, organization, and style are appropriate to task, purpose, and audience.
CCSS.ELA-Literacy.W.6.7 Conduct short research projects to answer a question, drawing on several sources and refocusing the inquiry when appropriate.
CCSS.ELA-Literacy.W.6.8 Gather relevant information from multiple print and digital sources; assess the credibility of each source; and quote or paraphrase the data and conclusions of others while avoiding plagiarism and providing basic bibliographic information for sources.
CCSS.ELA-Literacy.W.6.9, W.7.9, W.8.9 Draw evidence from literary or informational texts to support analysis, reflection, and research.
CCSS.ELA-Literacy.W.7.7 Conduct short research projects to answer a question, drawing on several sources and generating additional related, focused questions for further research and investigation.
CCSS.ELA-Literacy.W.7.8, W.8.8 Gather relevant information from multiple print and digital sources, using search terms effectively; assess the credibility and accuracy of each source; and quote or paraphrase the data and conclusions of others while avoiding plagiarism and following a standard format for citation.
CCSS.ELA-Literacy.W.8.7 Conduct short research projects to answer a question (including a self-generated question), drawing on several sources and generating additional related, focused questions that allow for multiple avenues of exploration.
CCSS.Math.Content.6.NS.B.3 Fluently add, subtract, multiply, and divide multi-digit decimals using the standard algorithm for each operation.
CCSS.Math.Content.6.SP.A.1 Recognize a statistical question as one that anticipates variability in the data related to the question and accounts for it in the answers.